
Graphologi visualisation
One of the questions we have received most frequently in discussions is 'can you visualise the concepts?'. With the 1.0.9 release of Graphologi we can now answer that question with a 'yes'.
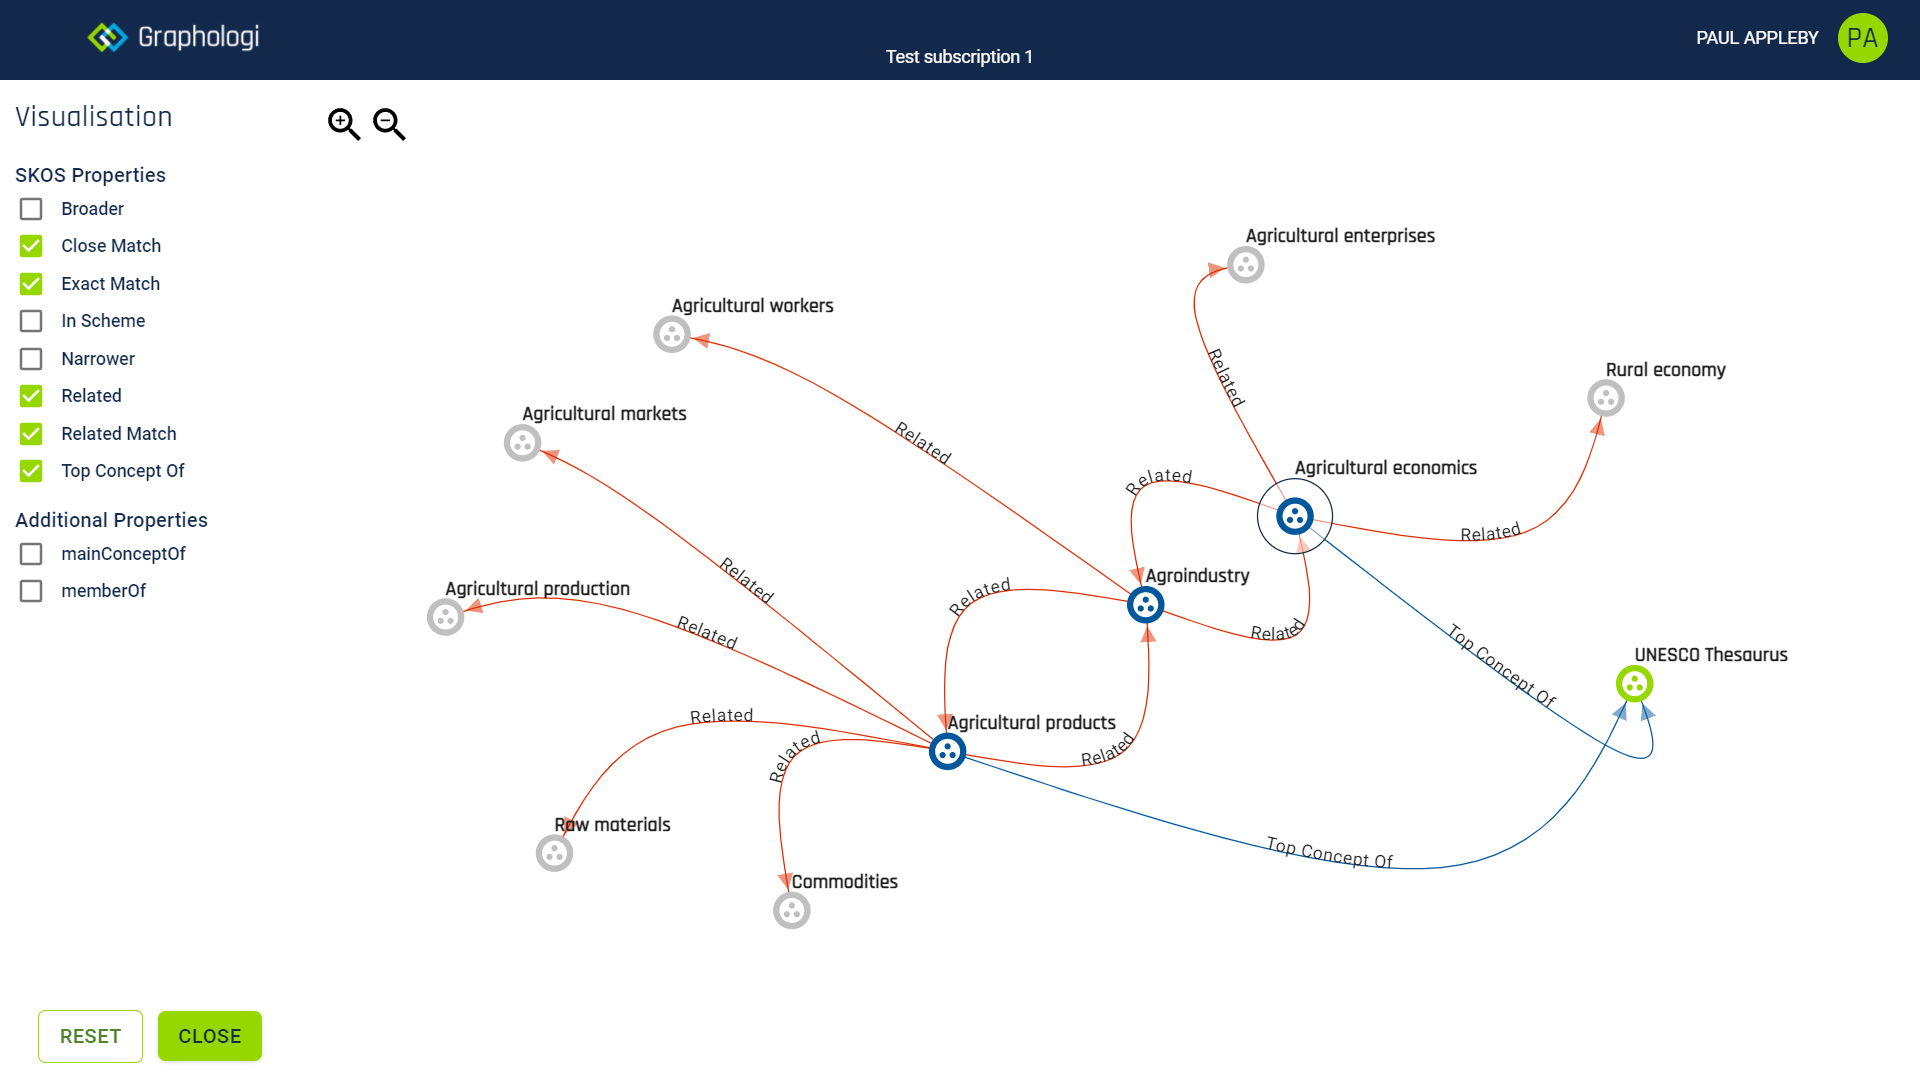
Visualisation in Graphologi lets you navigate around your graph of data starting from a concept. You can select which properties you wish to include and can expand the graph by including additional connected concepts.
An example is given below using the UNESCO thesaurus. This thesaurus has a large amount of 'related' connections (using the SKOS related property). The starting concept for this example is 'Agricultural economics' and you can see from the connections in the image how it relates to other concepts within UNESCO.
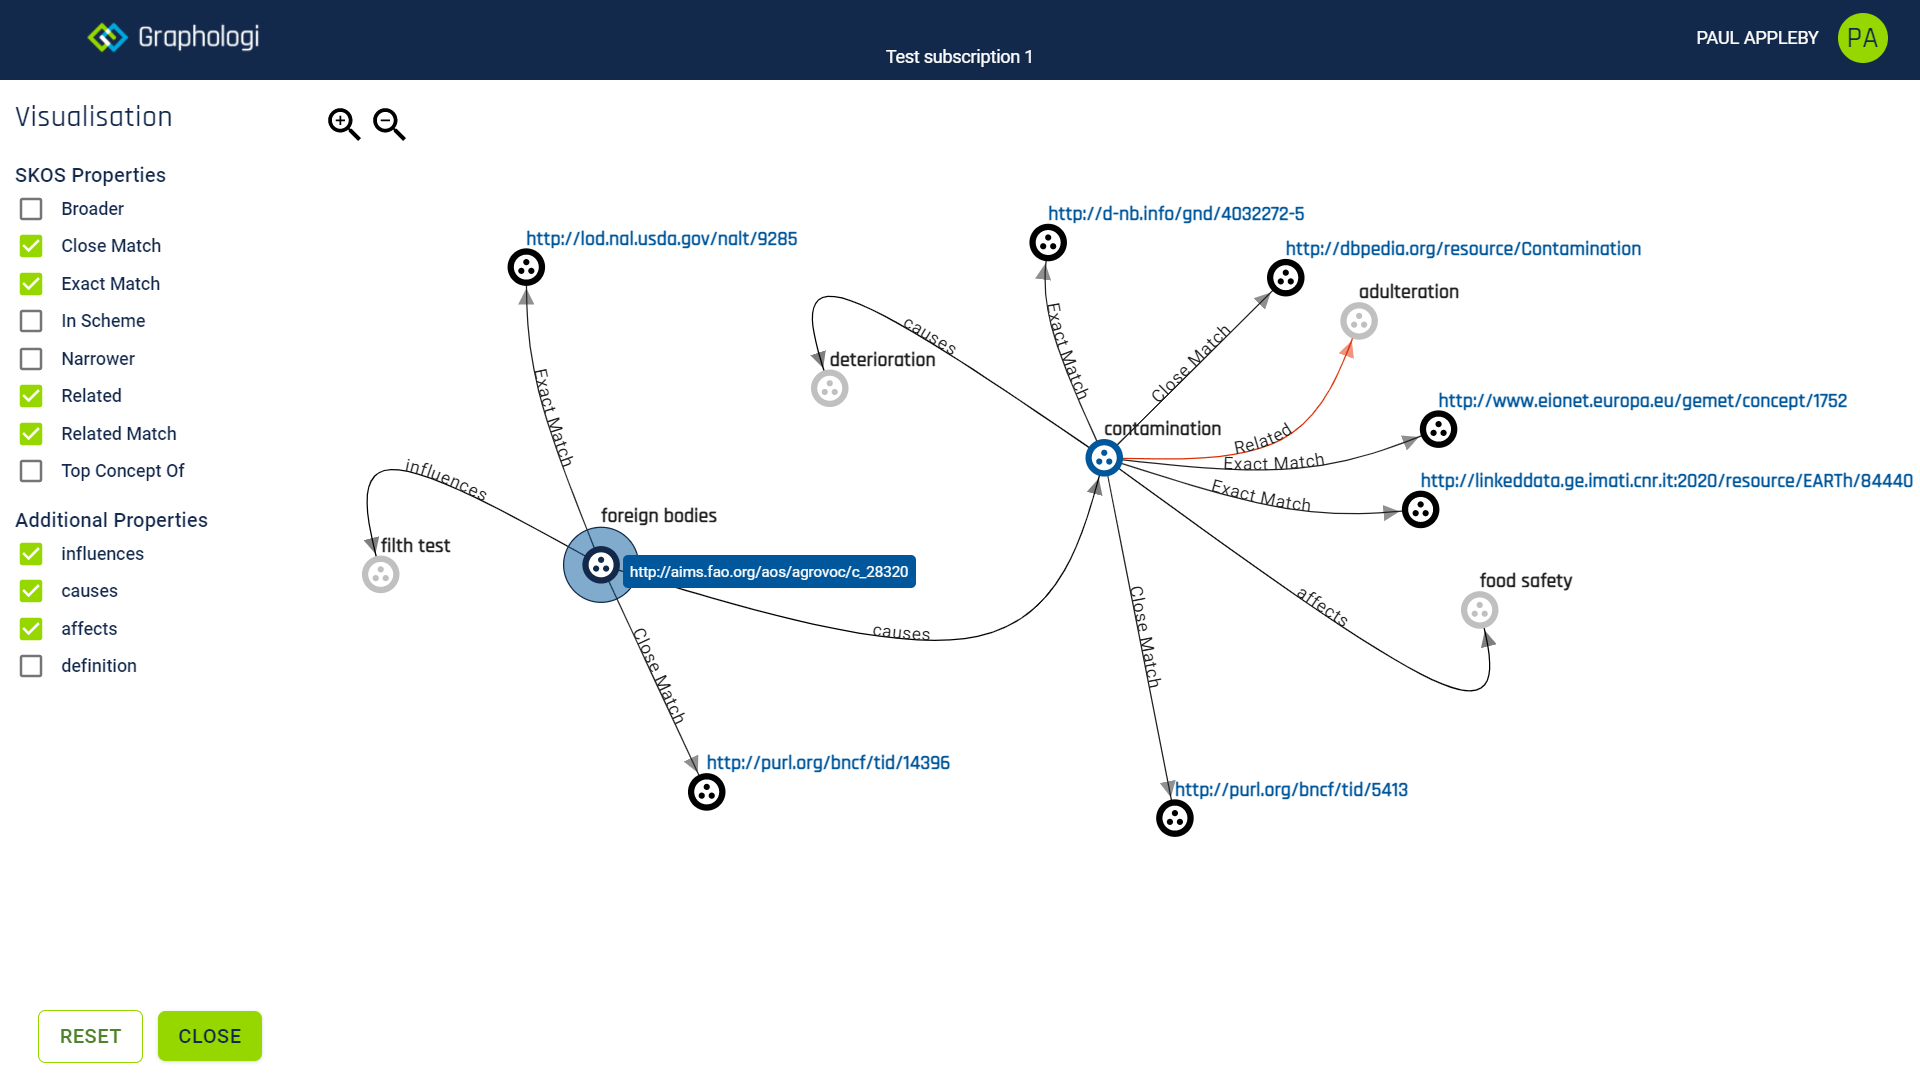
Displaying properties is not limited to the SKOS properties. Any relation can be visualised, including properties included from other ontologies within Graphologi. Another example using Agrovoc is given below, where we can see some of the Agrovoc specific properties being displayed.
Of course, because it is Graphologi and at its core is the GrafSync collaboration platform, that also means that if other users update the data any visualisation will update in real time.
This is just the first phase of visualisation work. We would very much like to hear more about what you would like to be able to do in terms of displaying your data and what you want to achieve, especially for larger graphs, which can quickly overload any visualisation without significant trimming back of the properties on display.

